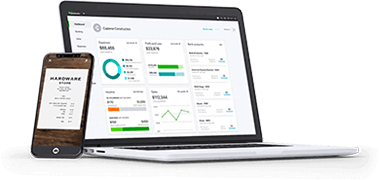
QuickBooks Enterprise
We provide Silver, Gold, Platinum, and Accountant packages for all your needs.

QuickBooks Point of Sale

QuickBooks Desktop
QuickBooks Premier Plus

QuickBooks Online
Quickbooks Online is one of the top small business accounting options.

Merchant Services
Credit and debit card processing is an important aspect to any business.

QuickBooks Payroll
QuickBooks Payroll is the #1 payroll provider for small businesses.

QuickBooks POS Supplies
Receipt paper, Thermal labels, & more!

Downloads
Download your QuickBooks Product
Why Choose Us?
We have over 100 years of combined industry experience. We have been working with and directly supporting QuickBooks® Accounting software and QuickBooks® Enterprise Solutions Premier and Pro, Point of Sale all the way back to QuickBooks® 3.0. Our knowledge and experience is extensive, with our current focus on helping new retailers get started with QuickBooks® Point-of-Sale and growing small and mid-size businesses with implementing QuickBooks® Pro, Premier, Enterprise Solutions and Online Edition.
Start Saving Your Business Money Today!
We are a Total Solution Provider for your small and mid-size growing business and/or retail store. Offering truly great deals and flexible payment methods on QuickBooks® Enterprise Solutions and QuickBooks® Point-of-Sale software and hardware is just a start with a full suite of custom and turnkey solutions. Whatever your need may be, we have you covered!


